Faculty Growth Trend Tables
Based on 2013-2019 workforce data. Click for larger versions.
For notes to the faculty headcount methodology, click here.
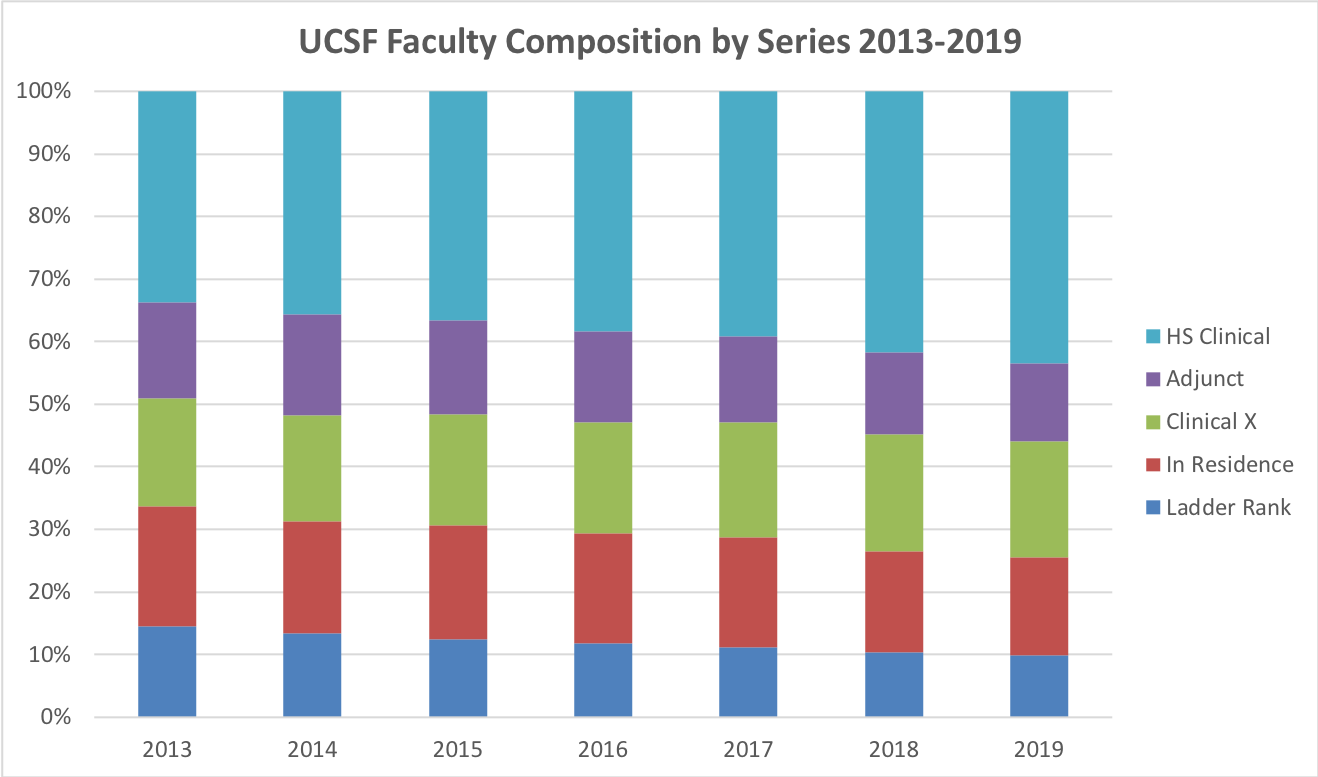
Faculty Composition By Series, 2013-2019
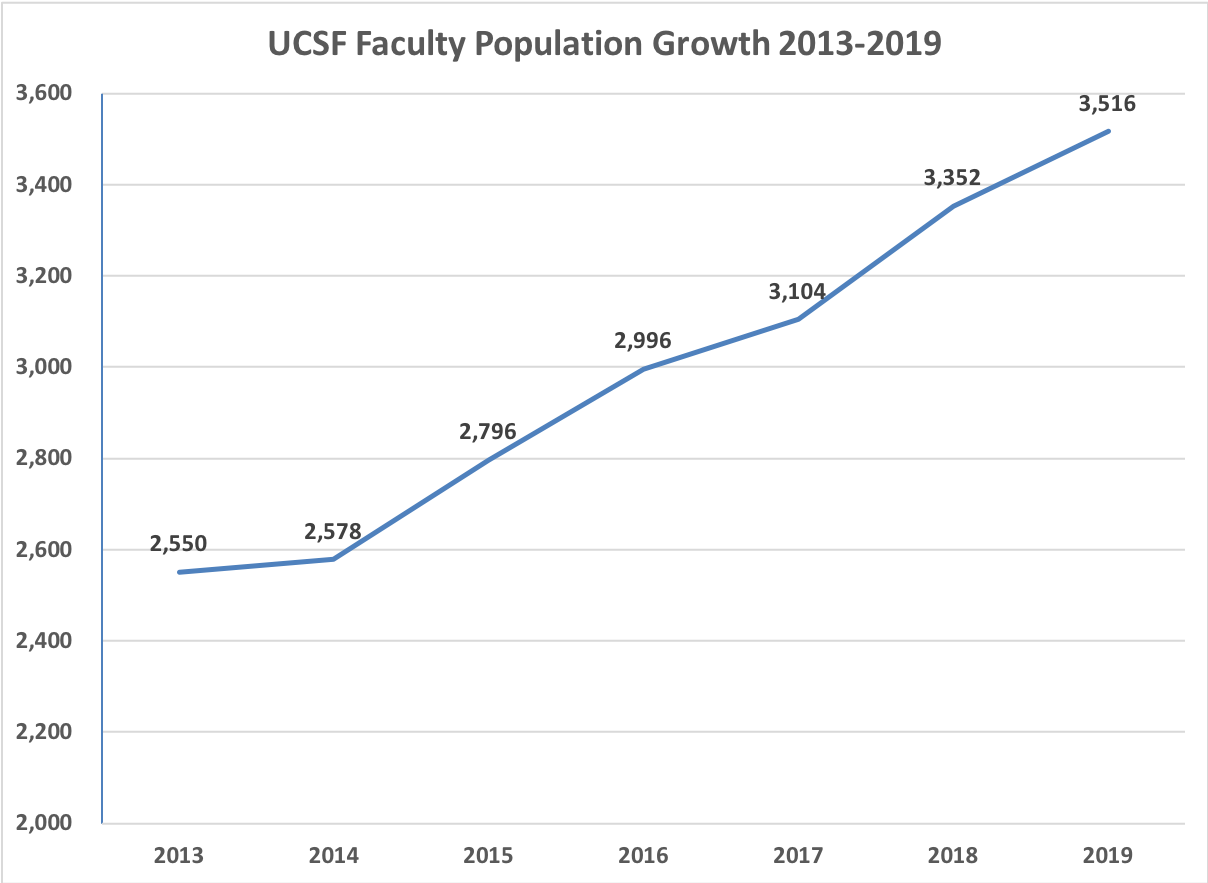
Total Faculty Growth 2013-2019
Faculty Growth 2013-2019 By Series, Bar Chart
.png)
Faculty Growth 2013-2019 By Series, Line Chart
.png)